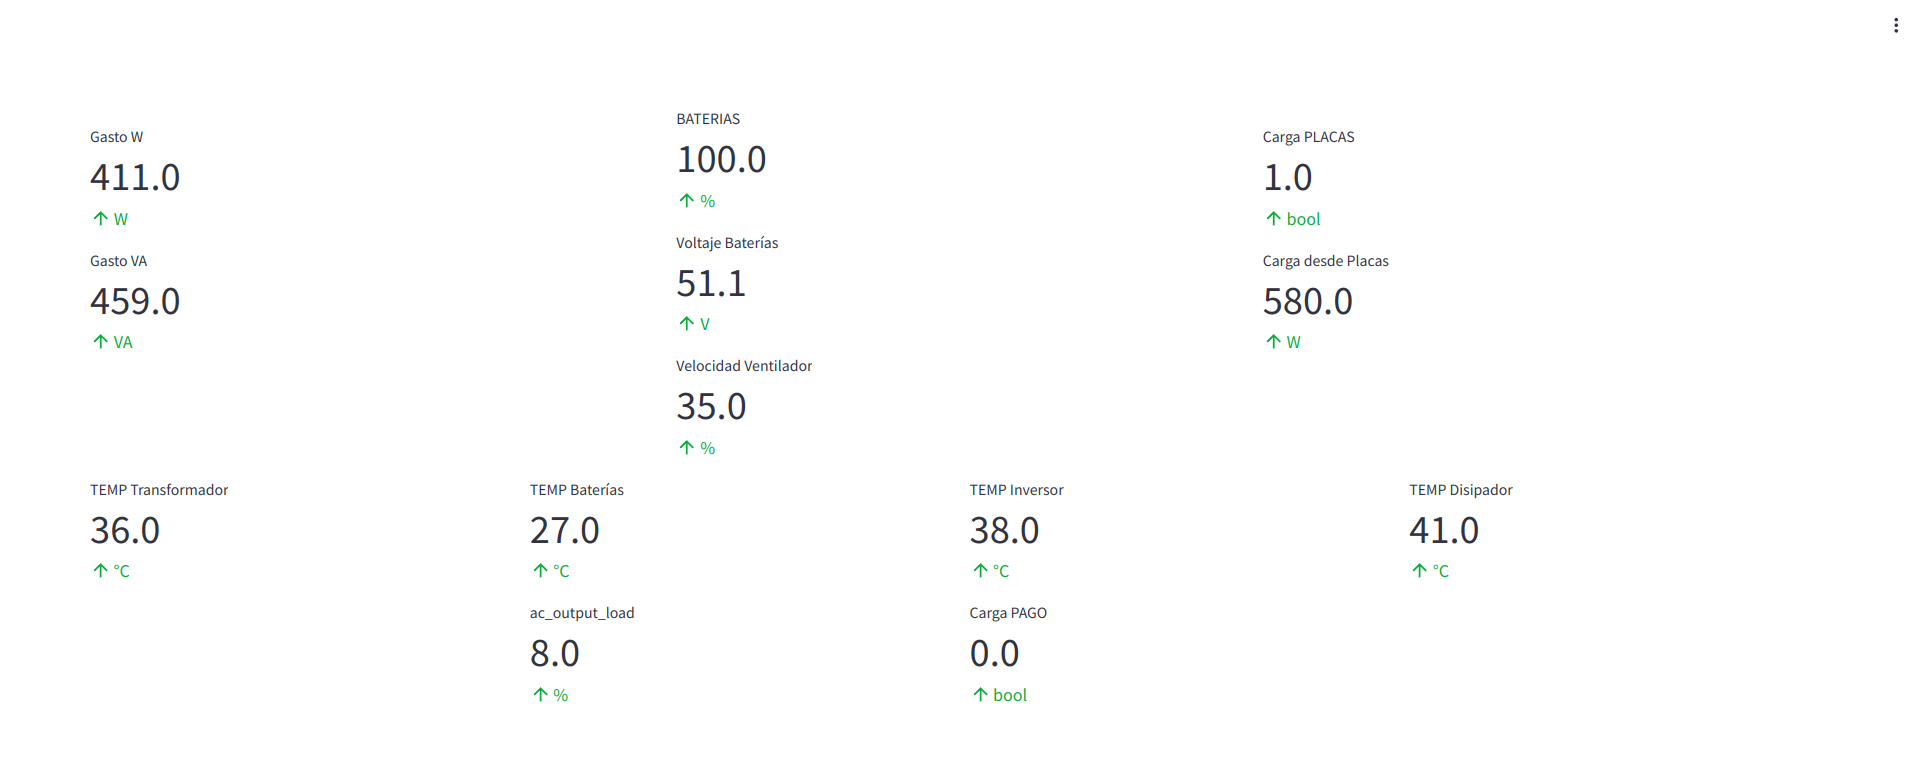
This is a
simple hack to show the status of the inverter and the
batteries of my solar installation:
- 8 solar panels of 450W.
- Solar inverter-charger: RCT AXMK4 5.6K 48V.
- Pylontech US3000C rechargeable batteries.
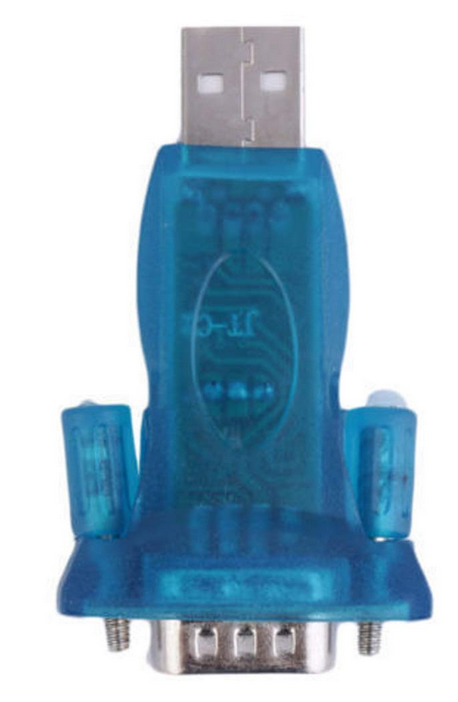
- USB 2.0 to RS232 Chipset CH340 Serial Converter, I found it thanks to this guy, normal serial USB converters won't work, it must be with Chipset CH340: https://www.youtube.com/watch?v=4IBsYsw1Ykw
- Old laptop with Devuan connected the the inverter with the serial converter.
Warning! Do no use F5 to refresh the web site,
use the R key.
- Command to run Streamlit on boot:
$ > streamlit run streamlit-WEB.py --server.address=Lan-IP
Where Lan-IP is an IP like 192.168.5.X in my LAN, so I can connect from all around the house.
- The Python code itself (do not blame me, I'm not a dev, it just works):
$ > cat streamlit-WEB.py
# import modules
import time # to simulate a real time data, time loop
import numpy as np # np mean, np random
import pandas as pd # read csv, df manipulation
import plotly.express as px # interactive charts
import streamlit as st # data web app development
import subprocess
st.set_page_config(
page_title="Datos del inversor",
layout="wide",
)
cmd_str1="INVERSOR/script-sed-CSV.sh"
subprocess.call([cmd_str1], shell=True)
## read csv from file
@st.cache_data(ttl=1)
def get_data() -> pd.DataFrame:
return pd.read_csv('INVERSOR/inversor.csv')
df = get_data()
# dashboard title
# st.title("Datos del inversor")
campo = df['Campo']
valor = df['Valor']
unidad = df['Unidad']
colcenter1, colcenter2, colcenter3 = st.columns(3)
with colcenter1:
st.write(' ')
st.metric(label="Gasto W", value=valor[3], delta=unidad[3])
st.metric(label="Gasto VA", value=valor[2], delta=unidad[2])
with colcenter2:
st.metric(label="BATERIAS", value=valor[8], delta=unidad[8])
st.metric(label="Voltaje Baterías", value=valor[6], delta=unidad[6])
st.metric(label="Velocidad Ventilador", value=valor[32], delta=unidad[32])
with colcenter3:
st.write(' ')
st.metric(label="Carga PLACAS", value=valor[19], delta=unidad[19])
st.metric(label="Carga desde Placas", value=valor[23], delta=unidad[23])
col1, col2, col3, col4 = st.columns(4)
with col1:
st.metric(label="TEMP Transformador", value=valor[31], delta=unidad[31])
with col2:
st.metric(label="TEMP Baterías", value=valor[30], delta=unidad[30])
st.metric(label=campo[4], value=valor[4], delta=unidad[4])
with col3:
st.metric(label="TEMP Inversor", value=valor[29], delta=unidad[29])
st.metric(label="Carga PAGO", value=valor[18], delta=unidad[18])
with col4:
st.metric(label="TEMP Disipador", value=valor[9], delta=unidad[9])
------
This code runs a bash script who will read the data from the inverter via serial with mpp-solar, and the output will be send to a formatted .csv file, then used in the python script:
$> cat script-sed-CSV.sh
#!/bin/bash
echo "Campo,Valor,Unidad" > INVERSOR/inversor1.csv
mpp-solar -p /dev/ttyUSB0 -P PI30 --getstatus | awk '{print $1,$2,$3}' | sed '1,5d;20d;35,38d;43,45d;47,63d' | sed -e 's/\s\+/,/g' >> INVERSOR/inversor1.csv
mpp-solar -p /dev/ttyUSB0 -P PI30 --getsettings | sed '1,3d;16d;19,43d' | sed -e 's/\s\+/,/g' >> INVERSOR/inversor1.csv
cat INVERSOR/inversor1.csv | sed 's/,$//' > INVERSOR/inversor.csv
exit 0
Hardware:
- 8 solar panels of 450W.
- Solar inverter-charger: RCT AXMK4 5.6K 48V.
- Pylontech US3000C rechargeable batteries.
- USB 2.0 to RS232 Chipset CH340 Serial Converter, I found it thanks to this guy, normal serial USB converters won't work, it must be with Chipset CH340: https://www.youtube.com/watch?v=4IBsYsw1Ykw
- Old laptop with Devuan connected the the inverter with the serial converter.
Software:
- Command to run Streamlit on boot:
$ > streamlit run streamlit-WEB.py --server.address=Lan-IP
Where Lan-IP is an IP like 192.168.5.X in my LAN, so I can connect from all around the house.
- The Python code itself (do not blame me, I'm not a dev, it just works):
$ > cat streamlit-WEB.py
# import modules
import time # to simulate a real time data, time loop
import numpy as np # np mean, np random
import pandas as pd # read csv, df manipulation
import plotly.express as px # interactive charts
import streamlit as st # data web app development
import subprocess
st.set_page_config(
page_title="Datos del inversor",
layout="wide",
)
cmd_str1="INVERSOR/script-sed-CSV.sh"
subprocess.call([cmd_str1], shell=True)
## read csv from file
@st.cache_data(ttl=1)
def get_data() -> pd.DataFrame:
return pd.read_csv('INVERSOR/inversor.csv')
df = get_data()
# dashboard title
# st.title("Datos del inversor")
campo = df['Campo']
valor = df['Valor']
unidad = df['Unidad']
colcenter1, colcenter2, colcenter3 = st.columns(3)
with colcenter1:
st.write(' ')
st.metric(label="Gasto W", value=valor[3], delta=unidad[3])
st.metric(label="Gasto VA", value=valor[2], delta=unidad[2])
with colcenter2:
st.metric(label="BATERIAS", value=valor[8], delta=unidad[8])
st.metric(label="Voltaje Baterías", value=valor[6], delta=unidad[6])
st.metric(label="Velocidad Ventilador", value=valor[32], delta=unidad[32])
with colcenter3:
st.write(' ')
st.metric(label="Carga PLACAS", value=valor[19], delta=unidad[19])
st.metric(label="Carga desde Placas", value=valor[23], delta=unidad[23])
col1, col2, col3, col4 = st.columns(4)
with col1:
st.metric(label="TEMP Transformador", value=valor[31], delta=unidad[31])
with col2:
st.metric(label="TEMP Baterías", value=valor[30], delta=unidad[30])
st.metric(label=campo[4], value=valor[4], delta=unidad[4])
with col3:
st.metric(label="TEMP Inversor", value=valor[29], delta=unidad[29])
st.metric(label="Carga PAGO", value=valor[18], delta=unidad[18])
with col4:
st.metric(label="TEMP Disipador", value=valor[9], delta=unidad[9])
------
This code runs a bash script who will read the data from the inverter via serial with mpp-solar, and the output will be send to a formatted .csv file, then used in the python script:
$> cat script-sed-CSV.sh
#!/bin/bash
echo "Campo,Valor,Unidad" > INVERSOR/inversor1.csv
mpp-solar -p /dev/ttyUSB0 -P PI30 --getstatus | awk '{print $1,$2,$3}' | sed '1,5d;20d;35,38d;43,45d;47,63d' | sed -e 's/\s\+/,/g' >> INVERSOR/inversor1.csv
mpp-solar -p /dev/ttyUSB0 -P PI30 --getsettings | sed '1,3d;16d;19,43d' | sed -e 's/\s\+/,/g' >> INVERSOR/inversor1.csv
cat INVERSOR/inversor1.csv | sed 's/,$//' > INVERSOR/inversor.csv
exit 0